There are various tools available which can be used to check and troubleshoot memory usage on a Linux/Ubuntu/Photon OS machines.
I have tried listed few of them here.
Please note all of the command line tools have the same source: the proc/meminfo virtual file.
– top :-
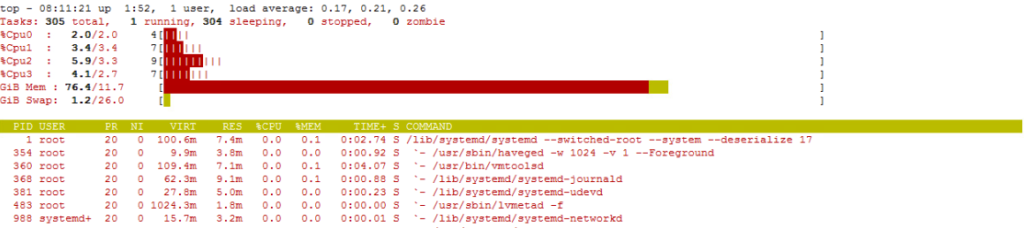
The top command is useful to check live/real time memory and CPU usage per process.
It displays below information :
- uptime
- average load
- tasks running
- number of users logged in
- number of CPUs/CPU utilization
- memory/swap system processes
- pid (process id)
Example :
– vmstat :-
vmstat provides general information about processes, memory, paging, block IO, traps, and CPU activity.
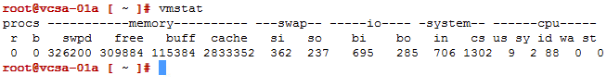
Here is the description of the each of the parameters –
- Procs
r: The number of runnable processes (running or waiting for run time).
b: The number of processes blocked waiting for I/O to complete.
- Memory
These are affected by the –unit option.
swpd: the amount of swap memory used.
free: the amount of idle memory.
buff: the amount of memory used as buffers.
cache: the amount of memory used as cache.
inact: the amount of inactive memory. (-a option)
active: the amount of active memory. (-a option)
- Swap
These are affected by the –unit option.
si: Amount of memory swapped in from disk (/s).
so: Amount of memory swapped to disk (/s).
- IO
bi: Blocks received from a block device (blocks/s).
bo: Blocks sent to a block device (blocks/s).
- System
in: The number of interrupts per second, including the clock.
cs: The number of context switches per second.
- CPU
These are percentages of total CPU time.
us: Time spent running non-kernel code. (user time, including nice time)
sy: Time spent running kernel code. (system time)
id: Time spent idle. Prior to Linux 2.5.41, this includes IO-wait time.
wa: Time spent waiting for IO. Prior to Linux 2.5.41, included in idle.
st: Time stolen from a virtual machine. Prior to Linux 2.6.11, unknown.
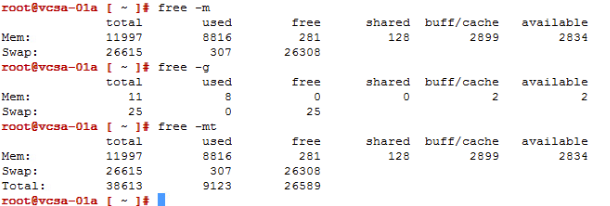
– free :-
This command gives the simple view of the amount of free and used memory.
Note : The output of this command is not in real time. Instead, what you’ll get is an instant snapshot of the free and used memory in that moment. The free command displays:
- Total amount of free and used physical memory
- Total amount of swap memory in the system
- Buffers and caches used by the kernel
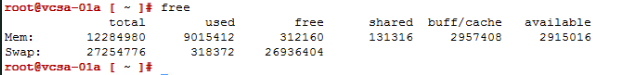
You can use -m(mb), -g (gb), -t(total) with free command to understand the value easily –
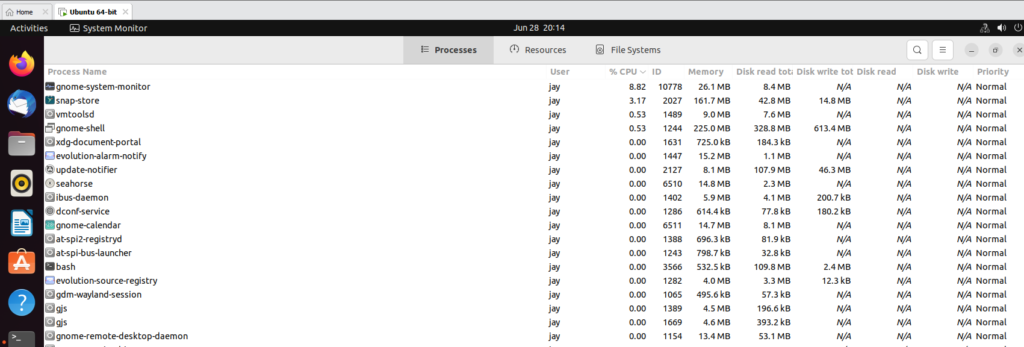
– GUI :-
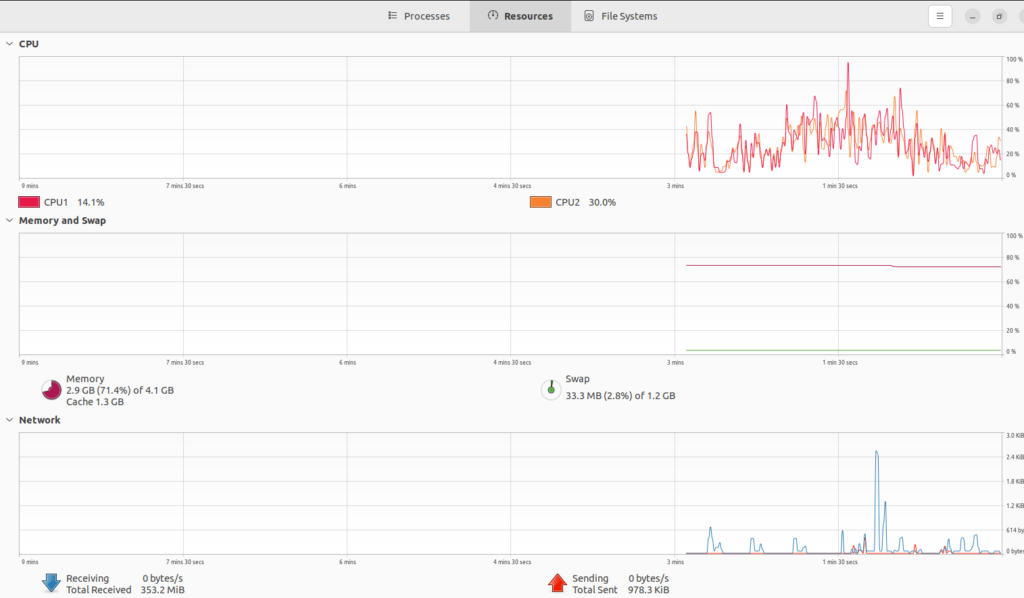
You can check the memory, CPU and network usage in real-time in GUI by using System Monitor.
Type “System Monitor” in the start menu’s search bar and press Enter. The System Monitor has two tabs we’re interested in: the Processes and Resources tabs. Resource tab gives the graphical view of the usage.
In the Processes tab, you can see all the processes that are currently running on your Linux operating system. Similar to Windows Task Manager, you can view the memory usage, CPU usage, and other data for each individual process. You also have option to kill the process from the same window by right-clicking on it and selecting the kill option.
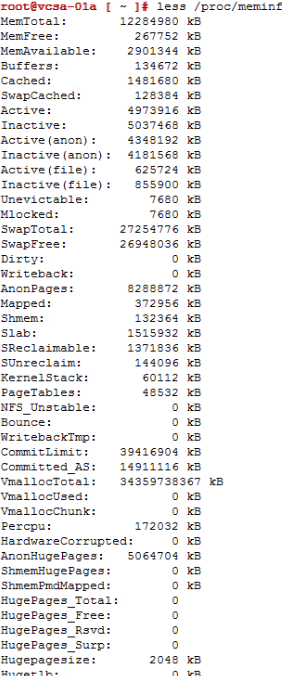
– /proc/meminfo :-
As I mentioned earlier, most of these tools fetch the information from the proc/meminfo file, which can be read directly.